


Yuichiro Chino/Moment via Getty Images
By Sonal Desai, Ph.D., Chief Investment Officer, Franklin Fixed Income
Franklin Fixed Income CIO Sonal Desai discusses why the January inflation print confirms that the “last mile” of disinflation may prove to be a lot harder than markets expect, and investors should brace for more volatility and a possible move of 10-year Treasury yields back in the 4.25%-4.50% range.
January’s US inflation print came as an unwelcome spoiler for financial markets, dealing what looks like the final blow to hopes of a March interest-rate cut, sending bond yields back up and triggering a major one-day correction in equities.
First, let’s put all this in perspective. Headline year-over-year inflation still came down – to 3.1% from December’s 3.40% – though remaining above the expected 2.9%. And the equity market correction, while a significant one-day move, still leaves in place the upward trend seen since October.
Having said this, there is a lot in January’s inflation report to support my long-held view that the “last mile” of disinflation is going to be a lot harder than markets expect, the Federal Reserve (Fed) will need to be very patient on monetary easing, and the new equilibrium we’re trending to will have markedly higher rates than we’ve been used to in the pre-inflation surge period.
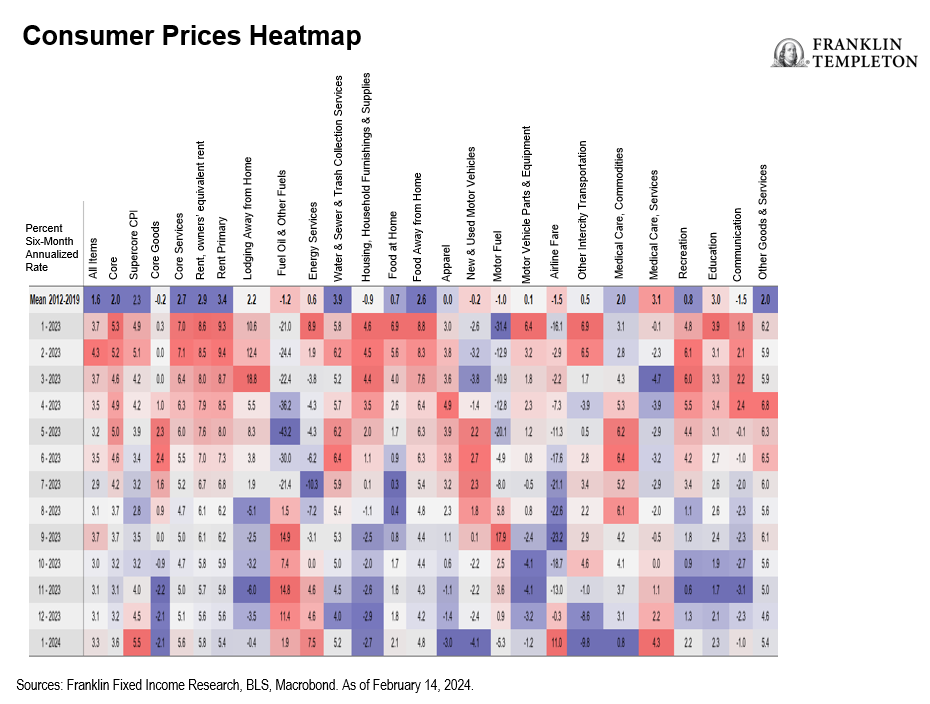
Start with “supercore” inflation, i.e., the price of services excluding energy and housing. The Fed has highlighted this as the measure that is likely most representative of underlying inflation trends and most sensitive to wage pressures. It was up 0.9% month-on-month, marking three continuous months of acceleration and the fastest pace of increase since April 2022. The acceleration was driven by medical services, recreation, education, communication, hotels, airfare and other intercity transportation – a rather wide range of categories. On a year-on-year basis, the supercore index change is well above 4%. More worrying still, on a six-month annualized basis, supercore inflation is now up 5.5% – not seen since late 2022 (see heat map below).
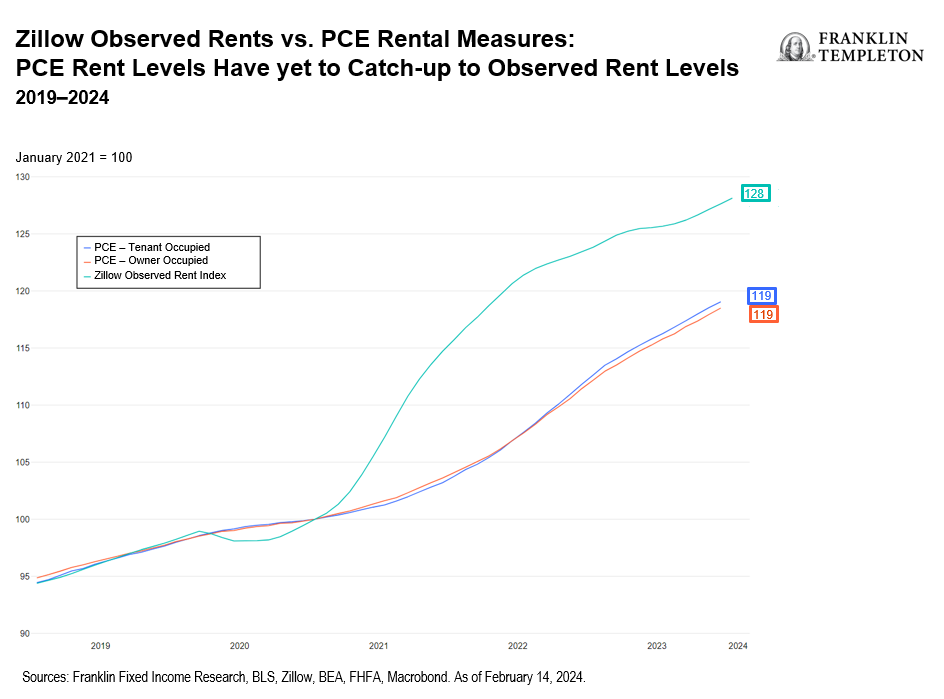
Looking at shelter, this component has been considered a reliable source of ongoing future disinflation, with the expectation that cheaper rental contracts feed into the inflation statistics with a lag. Here, we might be in for another disappointment. Owner-occupied rent accelerated in January. Moreover, my colleague Nikhil Mohan, economist and research analyst, Franklin Fixed Income, has highlighted that since early 2021, rents as measured in the personal consumption expenditures (PCE) have diverged substantially from rents as measured in the Zillow Observed Rent Index (see chart). In recent months, the increase in Zillow-measured rents has slowed, whereas the rent component in PCE keeps rising steadily, in a gradual catch-up. As you can see from the chart, PCE rents have a ways to go to close the gap with rent observed in Zillow. If a catch-up is indeed what is going on, we might still have quite a bit of pent-up inflation pressure in the rental cost component of inflation and therefore shelter might not contribute as much to disinflation as generally assumed.
Core goods prices declined for the third consecutive month. This is good news, confirming that the surge in core goods was largely transitory, and seems to be reversing with the normalization of supply chains.
Looking forward, however, I think we would do well to keep in mind three points:
- The US economy is obviously in rude health. We’ve seen strong numbers on the labor market, continued robust increases in wages, and upside surprises on consumer confidence, retail spending and gross domestic product growth. Against this background, it’s hardly surprising that disinflation has stalled. Yes, there was a transitory component due to supply disruptions which are now being resolved. But as I argued from the very beginning, higher inflation pressures partly reflected strong aggregate demand – and that keeps…
This article was originally published by a seekingalpha.com . Read the Original article here. .


